Skip to content

Product Suite

Data Visualization

Specialist capability. Shared platform. Agentic execution.

Data Visualization runs as part of the Advanze Execution Platform, so the application is not isolated software. It shares the same data foundation, workflow engine, security model and agentic AI fabric as the rest of the enterprise suite. Teams get the specialist capability they need without creating another silo.

Data and business teams reviewing analytics, resilience and recovery evidence.
Data Visualization starts with people trying to make the right call. It starts with a person trying to get data visualization work done without losing context. They need the next action to be clear, but they also need confidence that the platform has checked the risk, evidence, permissions and downstream impact.

Product Suite / Data Visualization

From application to execution capability

Advanze is positioned around the idea that enterprise software must evolve from passive systems of record into active systems of execution. In that model, this page is not just a feature description. It explains how Data Visualization contributes to an operating environment where people define intent, agents execute governed work, and leadership can see progress through unified data.

The value is strongest when the capability is connected to adjacent processes. Records, workflows, controls, communications and analytics should not live in separate tools. They should participate in a shared execution fabric that can coordinate work across departments while preserving human accountability.

Data and business teams reviewing analytics, resilience and recovery evidence.
Where Data Visualization becomes real work people can trust. The person is no longer carrying the full burden alone. Agents assemble context, route specialist checks, pause when judgement is required and record what happened so Data Visualization work feels calmer, faster and accountable.

Core capabilities

What Data Visualization enables

Each capability is designed to work as part of the broader execution platform rather than as a disconnected module.

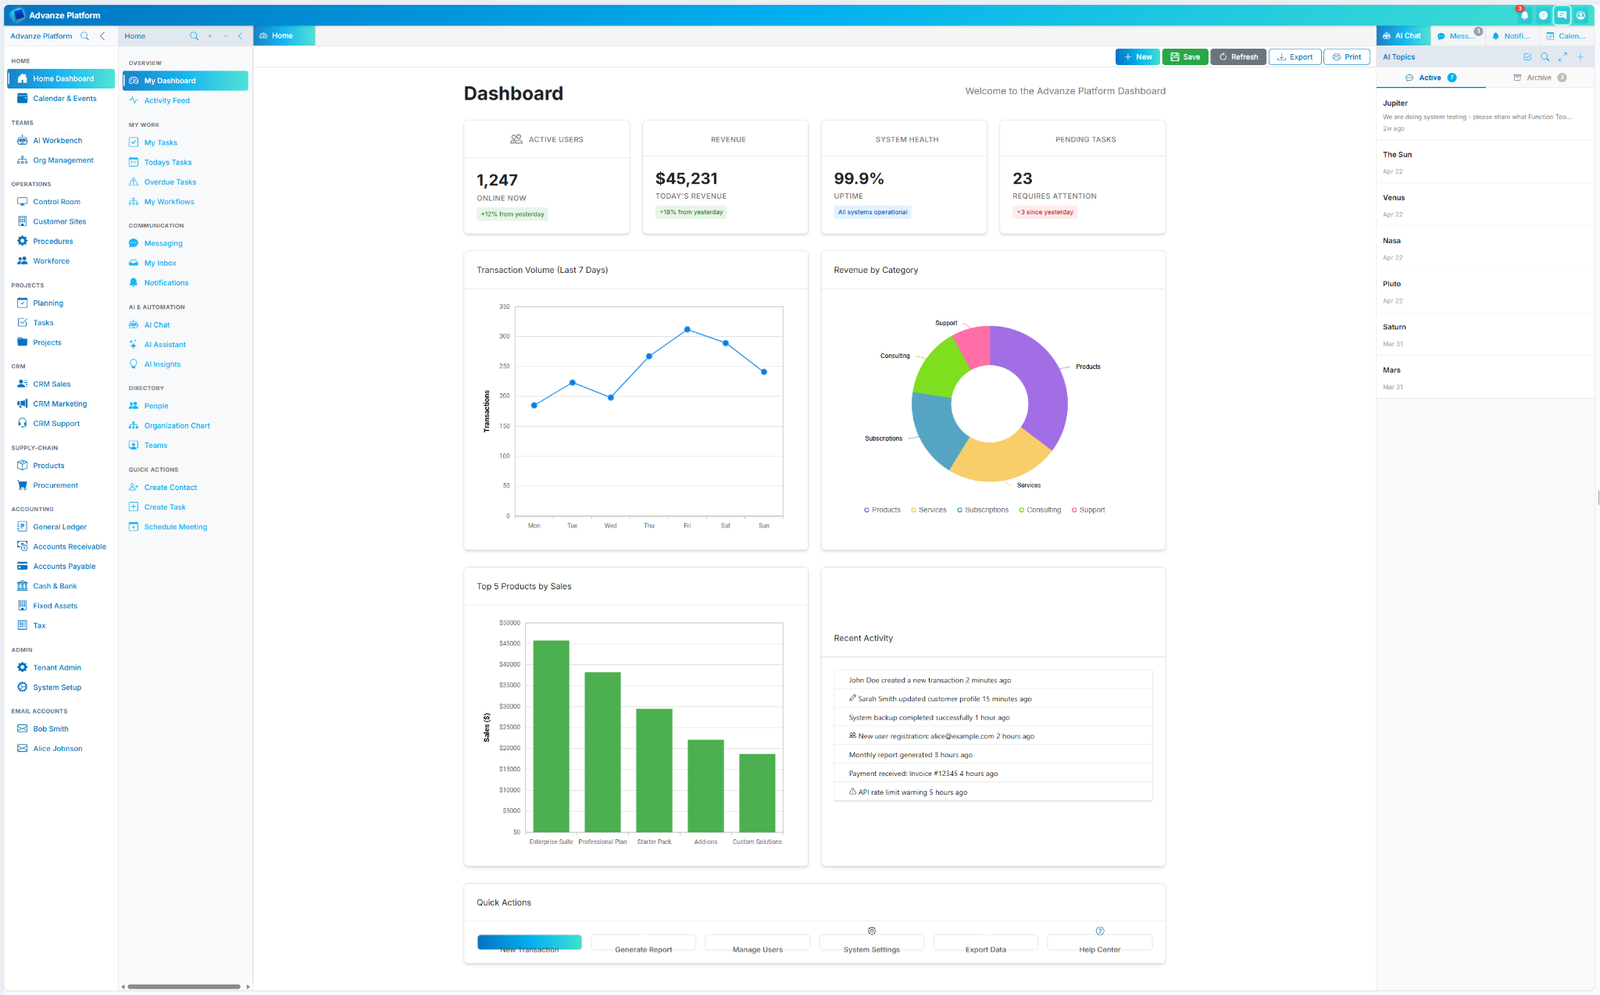
Interactive Chart Library

Create rich visualisations from platform data using an extensive chart library with bar charts, line graphs, scatter plots, heatmaps, and geospatial maps. All charts connect directly to unified data sources, ensuring visualisations reflect current state without data extraction.

Dynamic Filtering and Drill-Down

Enable users to explore data interactively with filters, time-range selection, and drill-down capabilities. Agents pre-aggregate data at multiple granularities, ensuring fast response times even when exploring millions of records across dimensions.

Composable Dashboard Builder

Assemble custom dashboards from reusable visualisation components without coding. Business users arrange charts, metrics, and tables through drag-and-drop interfaces while agents validate data access permissions and optimise query performance automatically.

Real-Time Data Streaming

Display live metrics that update as events occur across the platform. Visualisations subscribe to data streams from operational systems, reflecting changes in seconds rather than waiting for batch refresh cycles or manual report updates.

Role-Based View Customisation

Present contextually relevant visualisations based on user role, department, and responsibilities. Agents filter data according to access policies, personalise default views, and surface insights aligned with each user's decision-making scope.

Automated Distribution and Alerts

Schedule visualisation delivery to stakeholders and trigger alerts when metrics breach thresholds. Agents generate PDF reports, send dashboards via email, and notify teams of anomalies without manual intervention or separate reporting tools.

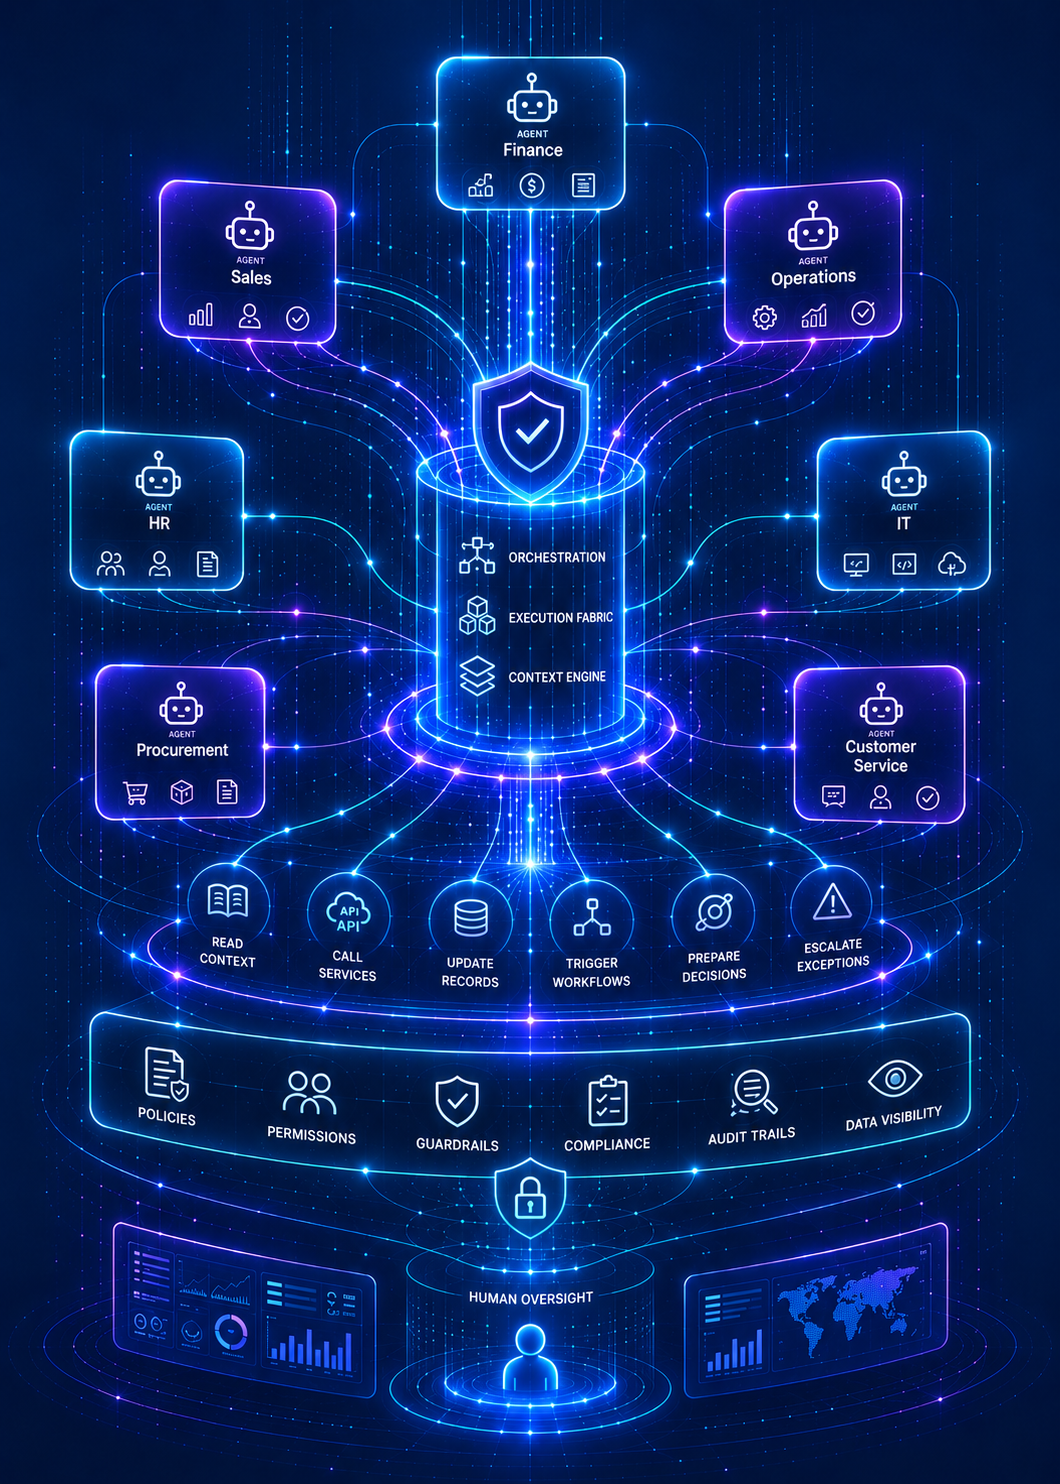
The Advanze Stack - Business Services, Platform Services, Technology Foundation

Agentic operating model

AI agents execute work inside the control model

Advanze treats AI agents as participants in the operating model. Agents can read context, call services, update records, trigger workflows, prepare decisions and escalate exceptions. Human teams remain responsible for judgement, governance and business accountability.

That distinction matters. The goal is not to add another chatbot to existing systems. The goal is to create an execution platform where work can move across functions with consistent permissions, policies, audit trails and data visibility.

Business outcomes

What becomes possible

Fewer silosShared data and workflows reduce duplicated effort.
Faster executionAgents can progress repeatable work across rules, approvals and systems.
Better visibilityLeaders see work, risk and performance in one operating context.
Lower platform sprawlSpecialised capability without another disconnected vendor.
People working through Data Visualization execution with clarity and confidence.
The outcome is not just automation. It is confidence in what happens next. The person is no longer carrying the full burden alone. Agents assemble context, route specialist checks, pause when judgement is required and record what happened so Data Visualization work feels calmer, faster and accountable.

Agentic use case

Where Data Visualization becomes governed execution.

It starts with a person trying to get data visualization work done without losing context. They need the next action to be clear, but they also need confidence that the platform has checked the risk, evidence, permissions and downstream impact.

What makes it harder in the real world: Data visualization work looks straightforward until it crosses people, systems, policies, approvals and customer impact. In practice, the work may require the right customer or employee context, policy checks, data quality, approvals, exception routing, integration updates and a clear audit trail.

What Advanze changes: Data Visualization turns data visualization activity into governed execution by connecting dashboard, metric, quality, lineage and decision context to agents, workflow, permissions, approvals and audit evidence before work is completed.

Data Visualization Intake AgentClassifies new data visualization work, identifies intent, urgency, context requirements and the likely execution path.
Data Visualization Context AgentGathers related records, history, documents, messages, policies, metrics and system state needed for data visualization decisions.
Data Visualization Processing AgentPrepares the recommended action, draft update, workflow step or system change for data visualization work.
Guardrail AgentChecks permissions, policy thresholds, sensitive data, financial exposure, compliance implications and approval requirements.
Workflow Orchestration AgentRoutes reviews, manages approvals, records evidence and coordinates safe system updates after approval.
Challenge

Data Visualization starts as a single app experience, but the real work usually depends on context from other teams, policies, data and systems.

Orchestration

Advanze treats Data Visualization as part of a governed execution fabric. The app captures the work, agents gather context, workflow routes approvals and the control model determines what can safely happen next.

Success

Data Visualization becomes more than a screen. It becomes a reliable path from intent to controlled action, with people still responsible for judgement and the platform carrying evidence.

Data and business teams reviewing analytics, resilience and recovery evidence.
Data confidence 11Data, analytics and resilience work connecting business decisions to governed evidence.
Data and business teams reviewing analytics, resilience and recovery evidence.
Data confidence 12Data, analytics and resilience work connecting business decisions to governed evidence.
Data and business teams reviewing analytics, resilience and recovery evidence.
Data confidence 13Data, analytics and resilience work connecting business decisions to governed evidence.

Why AI execution needs architecture

The work needs context, controls and clear permissions before automation can safely act.

Data Visualization is valuable when it participates in the Advanze control model: identity, permissions, workflow, policy checks, data context, audit evidence and human approval boundaries sit inside the execution path.

  • Data Visualization work needs the right dashboard, metric, quality, lineage and decision context before an agent or user can act with confidence.
  • The process often crosses handoffs, approvals, exception paths, SLAs and downstream system updates.
  • Different actions need different permission levels: read, draft, update, approve, send, pay, create, close or escalate.
  • The business needs evidence of what was requested, what was checked, who approved, what changed and why.

Implementation path

How to move from concept to production

Advanze can be introduced progressively. The recommended path is to start with a visible workflow, prove the operating model, then expand into adjacent capabilities as the platform foundation matures.

  1. 1
    Assess the current operating model

    Map the workflows, systems, data sources and manual coordination points around this capability.

  2. 2
    Design the target execution flow

    Define the data model, human approvals, agent tasks, service calls and governance controls.

  3. 3
    Launch a focused implementation wave

    Start with a bounded use case that proves the operating pattern and creates reusable platform assets.

  4. 4
    Scale across the business

    Extend the pattern to adjacent workflows, more agents, more users and deeper integrations.

Next step

Build this into your execution platform roadmap

Explore how Data Visualization can be implemented as part of a broader Advanze platform adoption programme, from first pilot to enterprise scale.